Targets Dashboard
The Targets Dashboard provides real-time access to the latest security scan outcomes for individual targets, both during and after completion of the scan process. Additionally, you have the option to review previous security scans conducted under various configurations, including those utilizing identical Scan Policies and Scan Settings. This document explains the information available to view on the Targets Dashboard
How to view the Targets Dashboard
The Targets Dashboard can be accessed by following these steps:
- Log in to Acunetix 360.
- Select Targets > Targets.
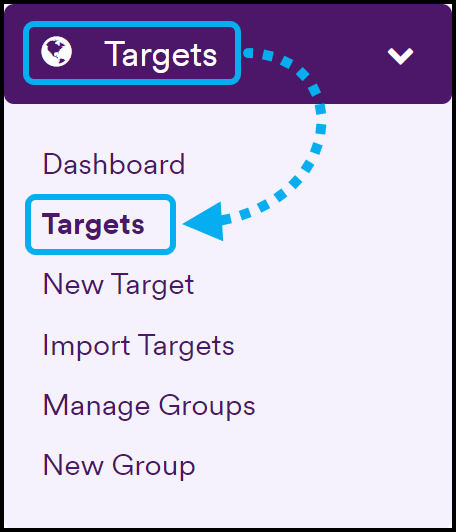
- Click on the Name of a target to open its dashboard.
- Optionally, switch from the default view to a customized view according to your preference.
Default view
The default view shows information about all scan groups. The information is grouped and displayed on interactive widgets. Each of those widgets is explained in the later sections of this document.
Customized view
Using the drop-down, you can filter the displayed information by:
- All Scan Groups: This will show scan information for all scan groups.
- A specific Scan Group: This will show scan information for the selected combination of Scan Policy and Report Policy.
The information displayed on the dashboard updates as soon as you select a customized view.
Targets Dashboard widgets
The Targets Dashboard contains many widgets that display graphs and tables pertaining to your scan results. Refer to the individual sections below to learn about the information displayed on each widget.
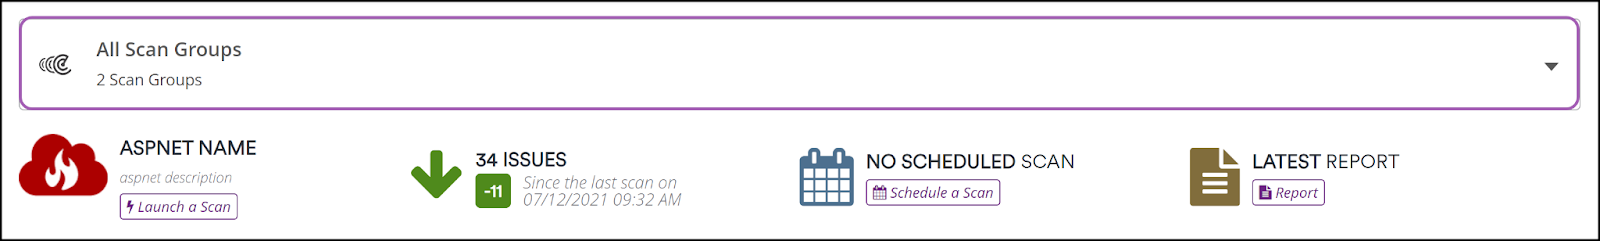
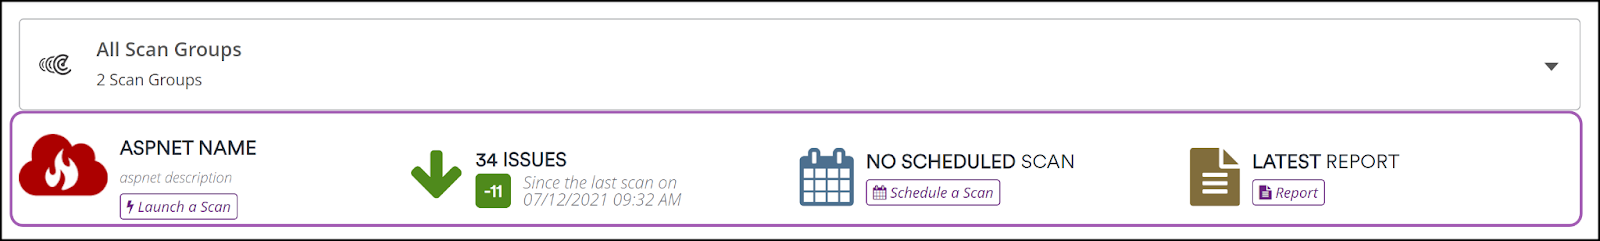
Top panel
The top panel of the dashboard showcases the following widgets:
- Target Name: Displays the name of the target with a Launch a Scan button.
- Issues Counter: This counter shows the number of issues detected on the specific target since the last scan and indicates the variance in numbers.
- Next Scan: Provides the date and time of the next scheduled scan, or a Schedule a scan button if no scans are scheduled yet.
- Latest Report: The Report button in this widget takes you to the Scan Summary page where you can explore the Technical Report.
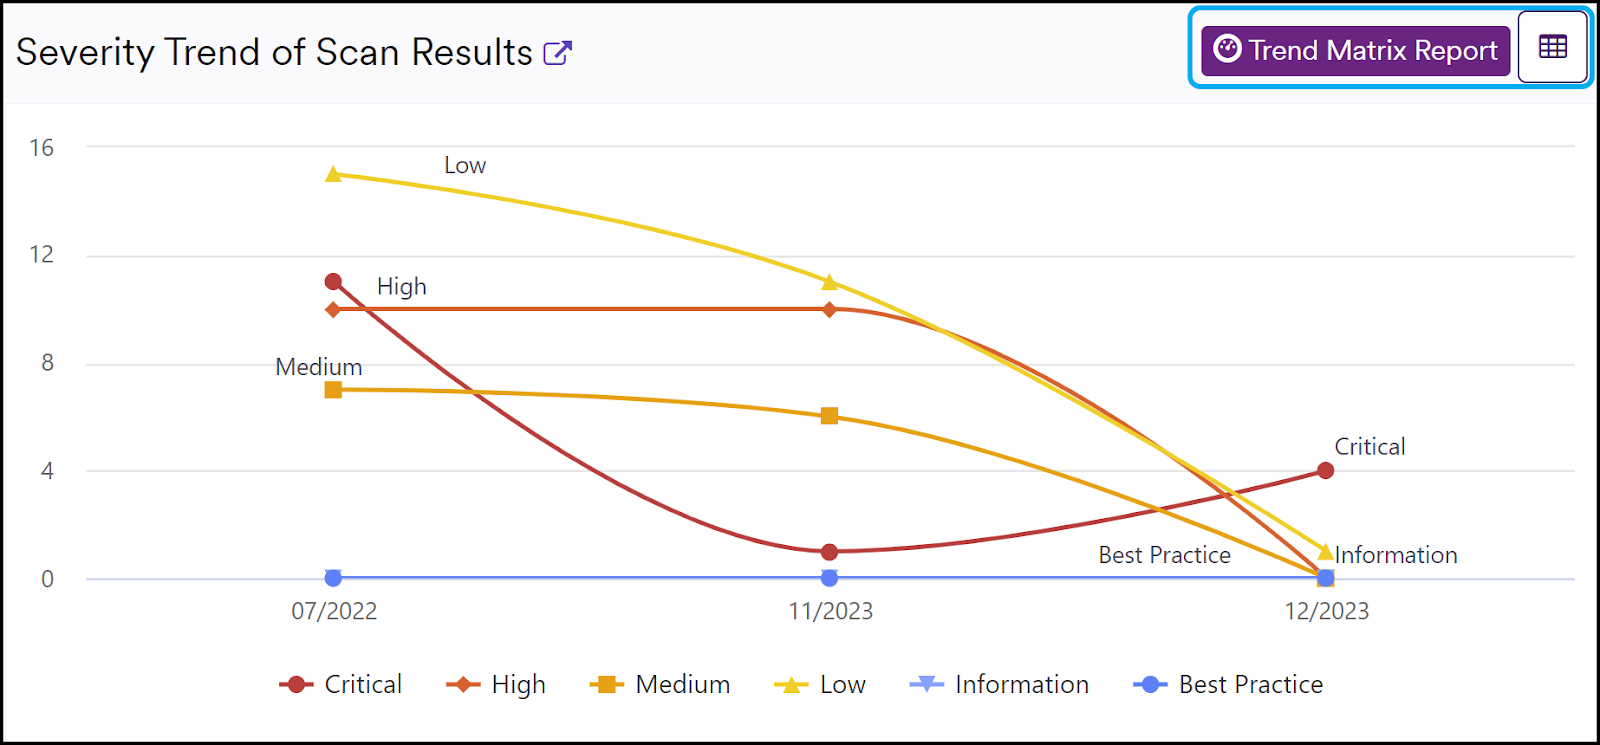
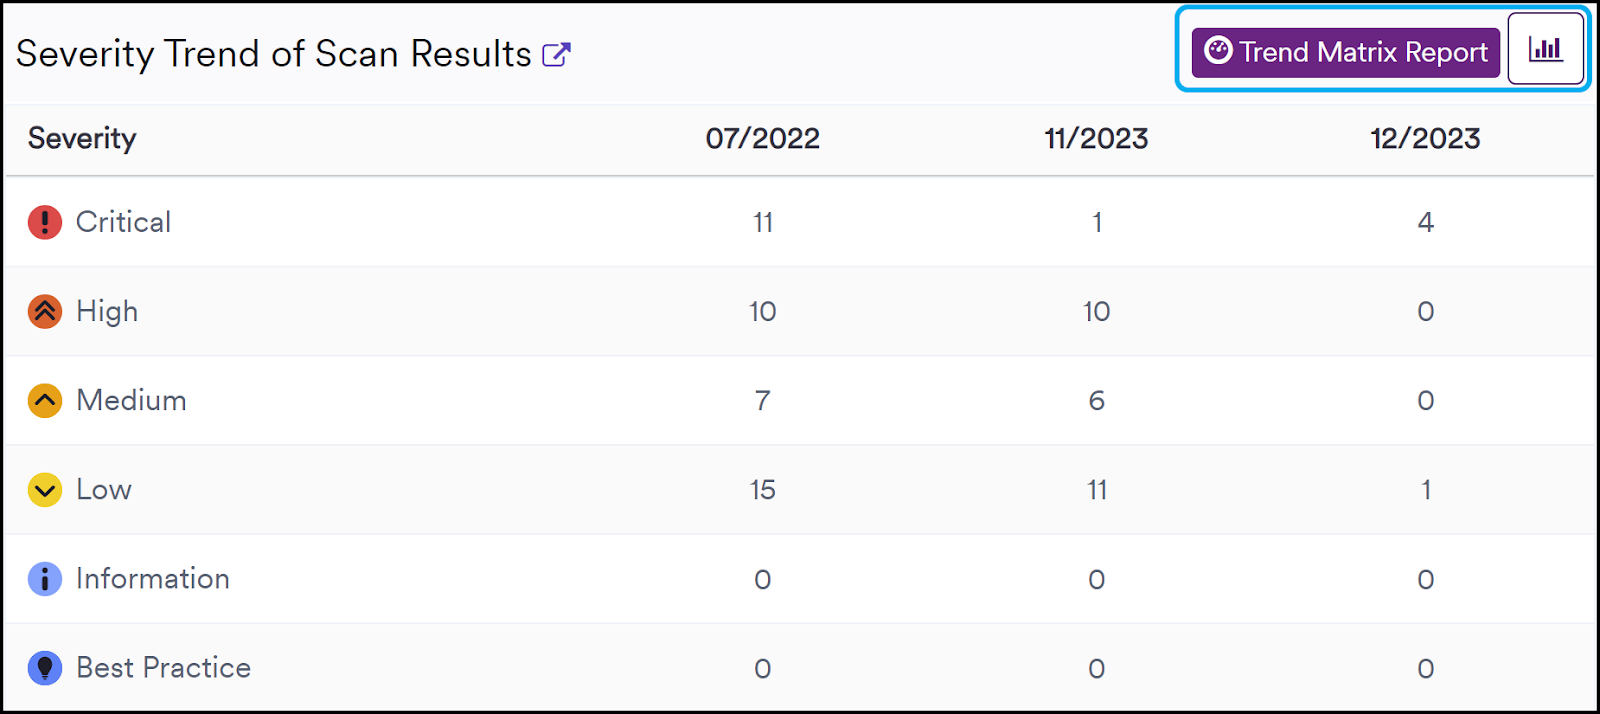
Severity Trend of Scan Results
This widget visualizes issues grouped by Vulnerability severity level, allowing you to compare the count and view the increase or decrease of each severity over time by hovering over the lines. Click the Trend Matrix Report (Severity Trend Report) for a more comprehensive overview. The Trend Matrix Report is generated only if you run more than one scan. Click the icon in the top-right corner to toggle between a table view and a chart view.
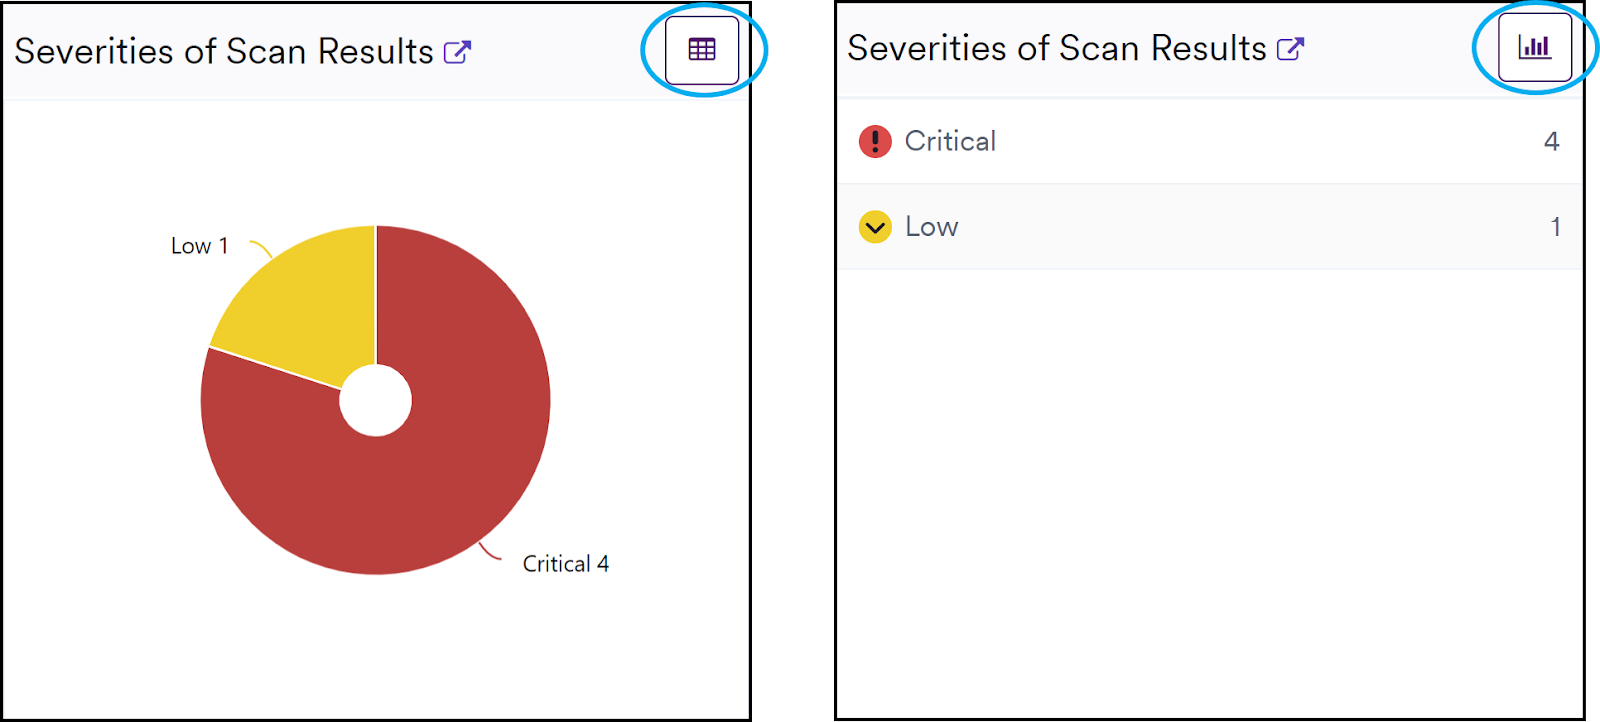
Severities of Scan Results
The Severities of Scan Results widget presents a pie chart depicting each severity category along with its respective count. The data in this pie chart reflects the latest scan information. The values presented here align with those found in the last column of the Severity Trend of Scan Results widget located above.
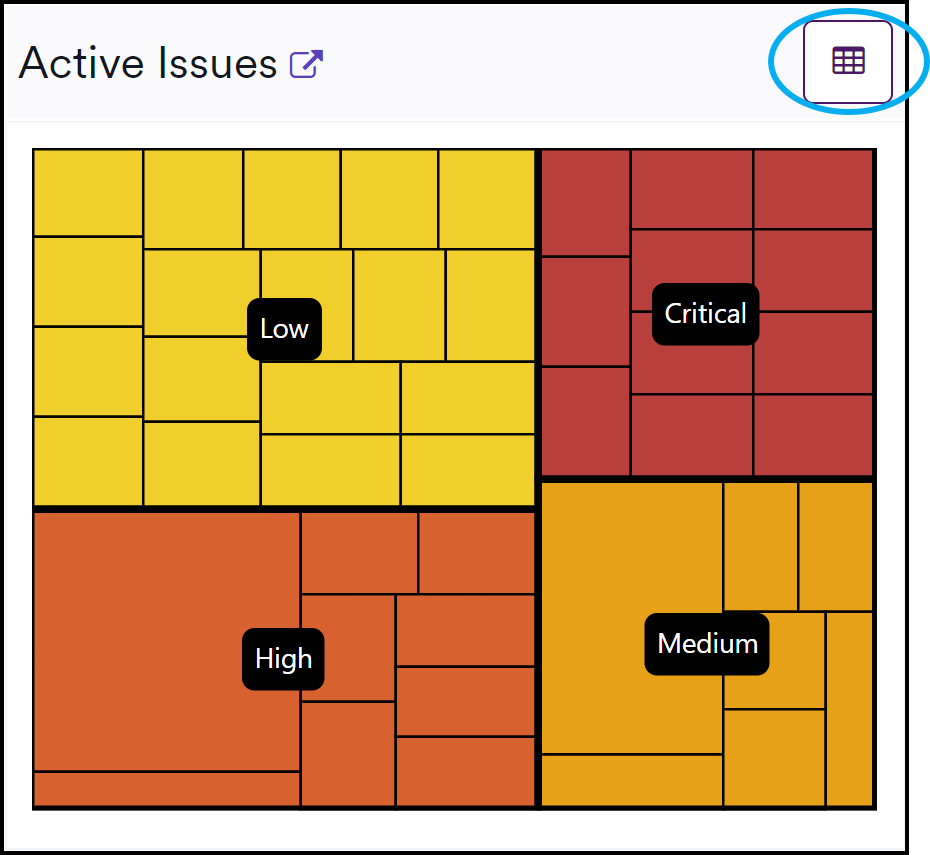
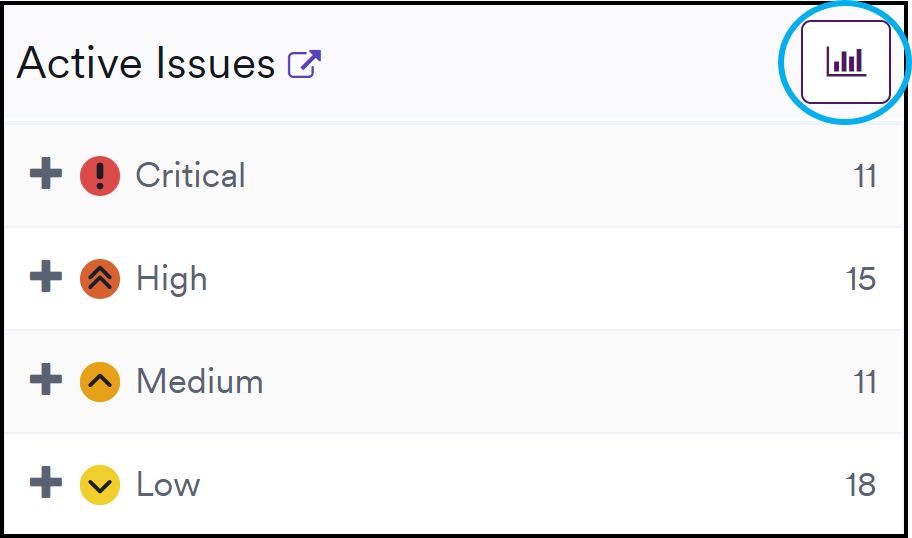
Active Issues
The treemap representation of active issues offers an overarching view of the current issues, with the option to drill down deeper for further exploration. The total count of all Active issues in this widget matches the total number of active issues in the top panel. Click the icon in the top-right corner to switch between a chart view and a table view.
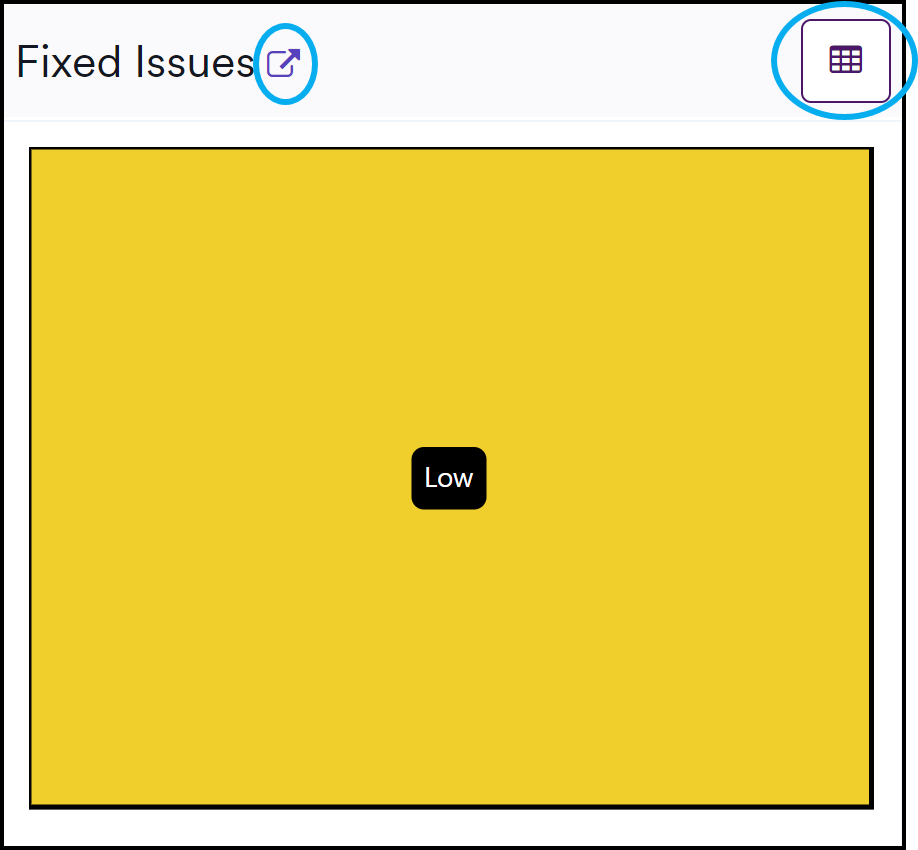
Fixed Issues
This column chart displays the number of Issues that have been fixed in each Vulnerability Severity Level within the specified date range. In the screenshot below, 1 Low vulnerability was fixed. The link button on the left will take you to the Issues > All Issues screen, where a filter has been applied based on your configuration on the Global Dashboard (Target Group selection, Date Range specification, and Issue present = No).
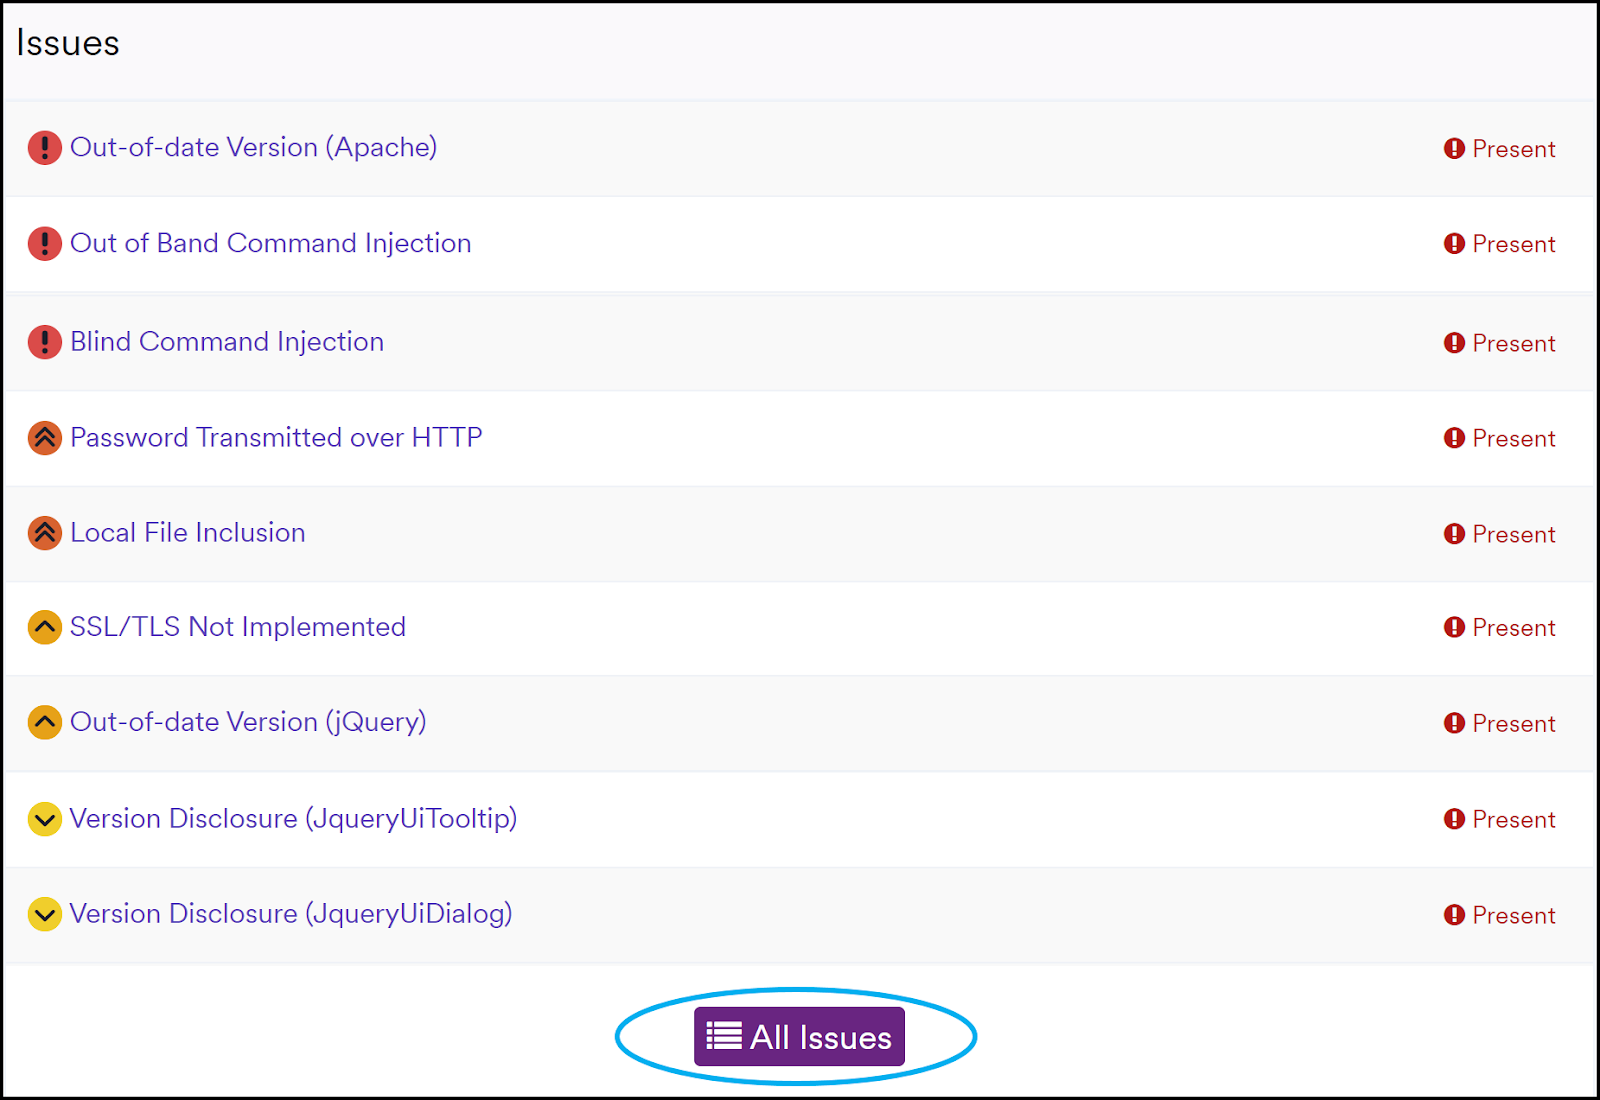
Issues
This table shows the number of Issues found, grouped by Vulnerability Severity Level. For more information, refer to Viewing Issues in Acunetix 360. Clicking All Issues will take you directly to the Issues > All Issues page.
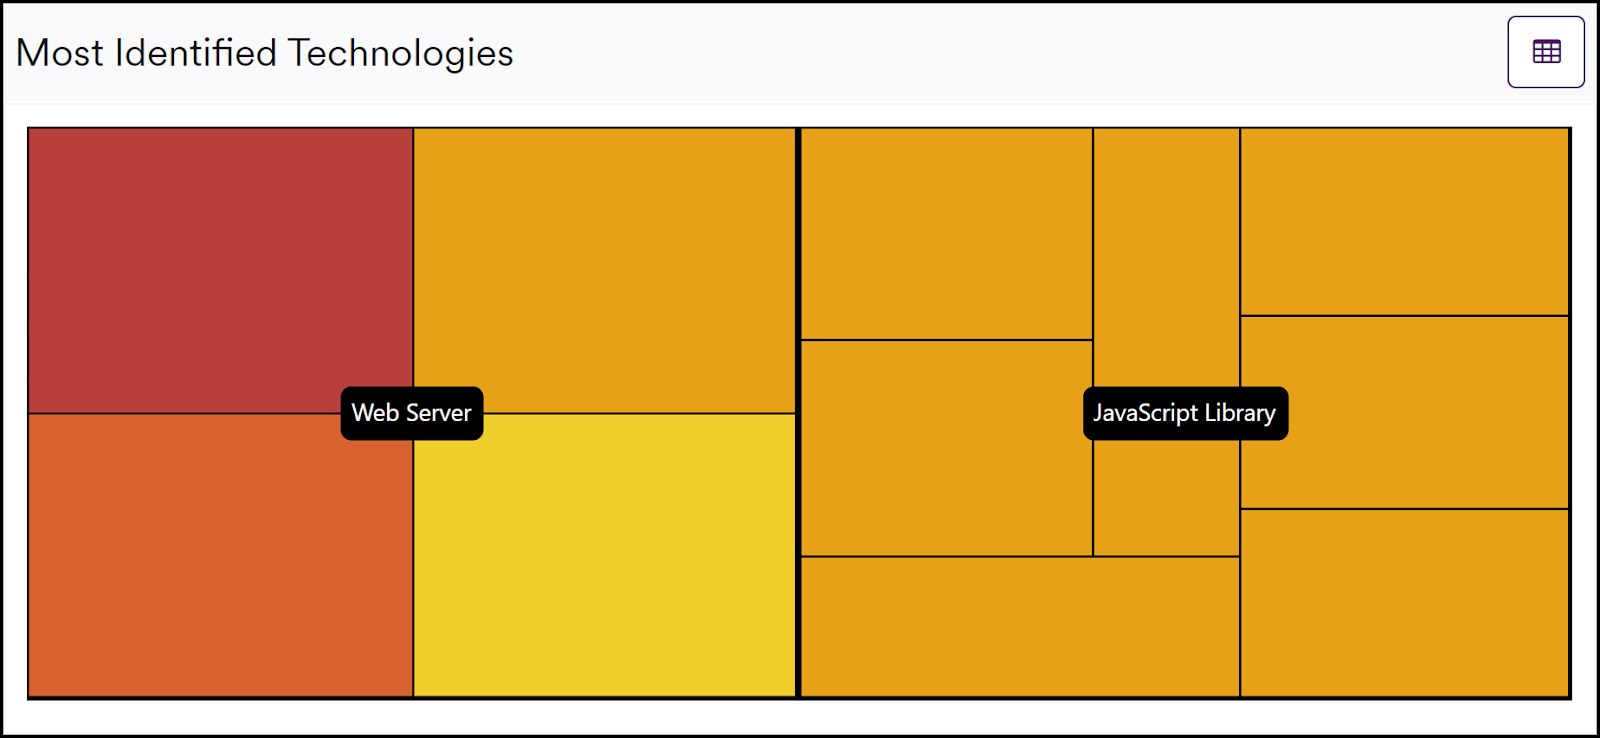
Most Identified Technologies
The Most Identified Technologies widget offers insights into the versions of the most commonly identified technologies. Clicking on the panels in the widget takes you to the Technologies Dashboard.
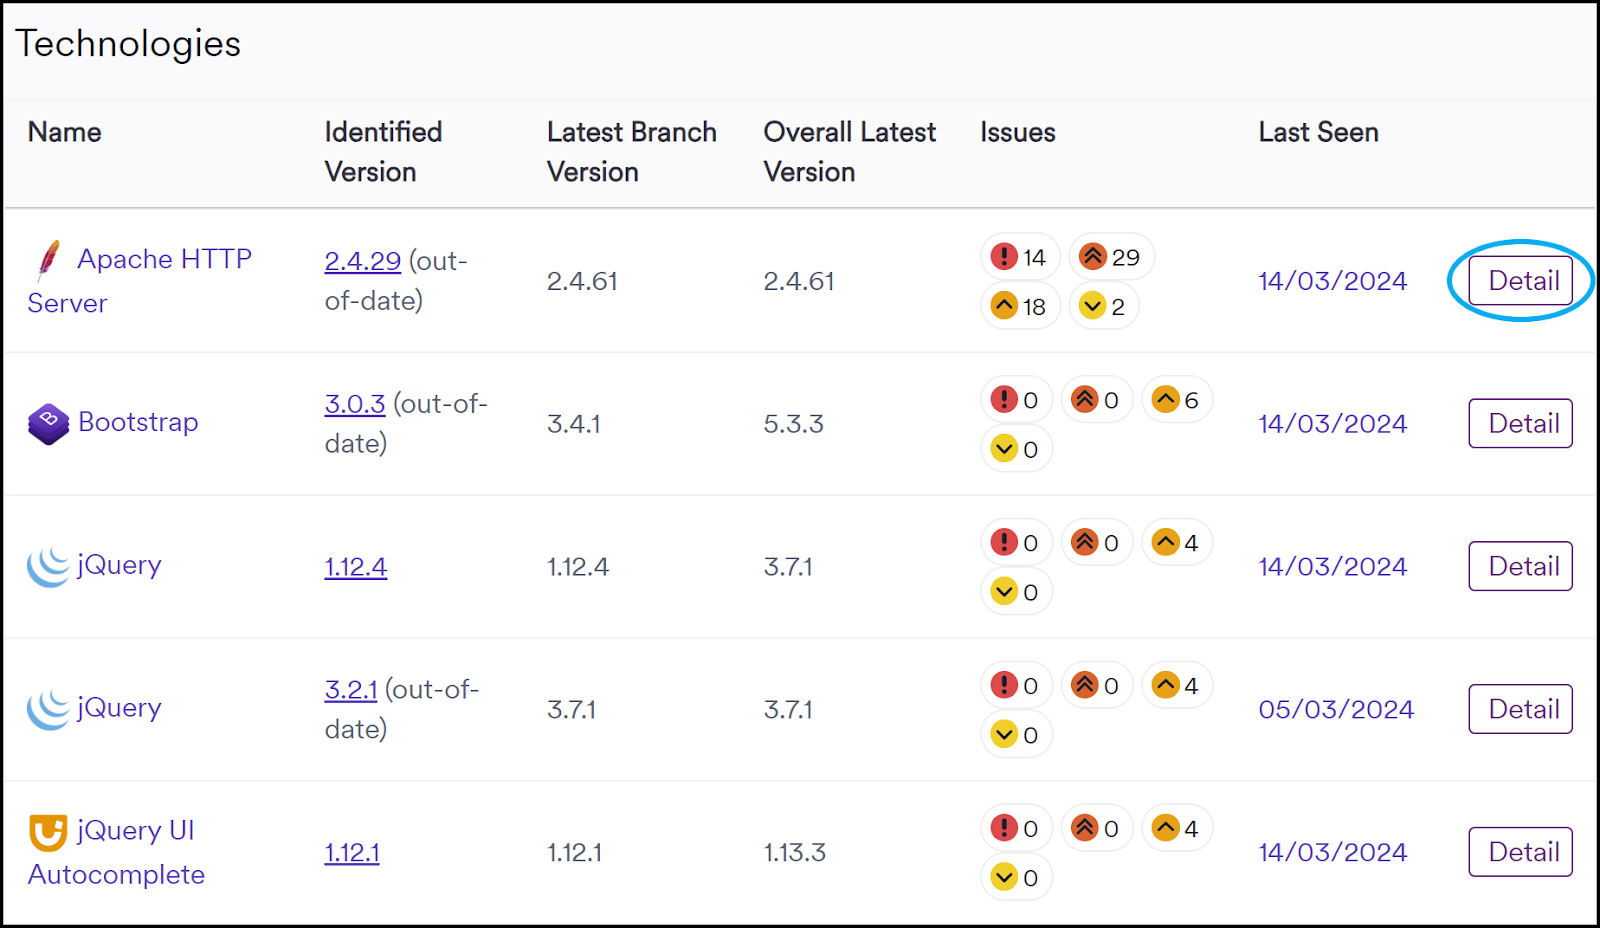
Technologies
The Technologies widget offers a summary of detected technologies, including any that are outdated. It also provides information on the Latest Branch versions and Overall Latest versions, along with associated issues for each technology. Clicking Detail on the right-hand side will take you to the Technology Detail page.
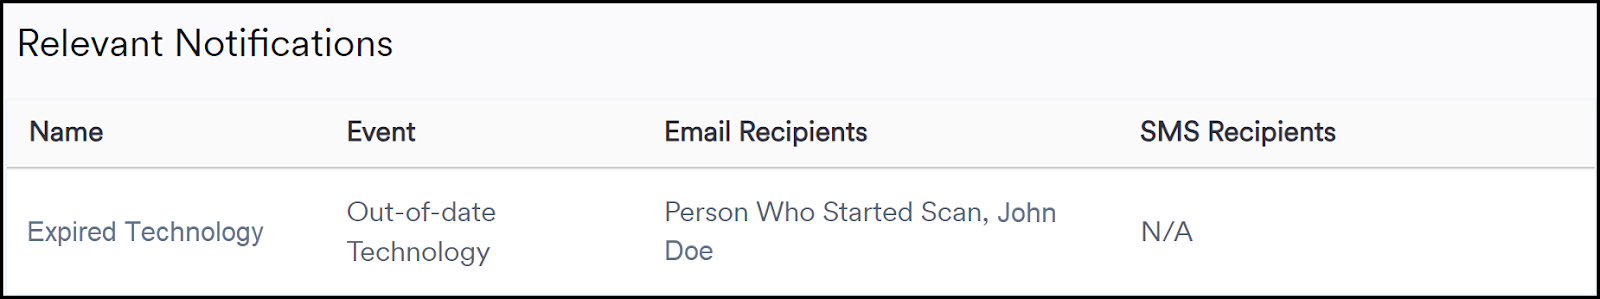
Relevant Notifications
This widget compiles all notifications from the scan and presents details such as Name, Event, Email Recipients, and SMS Recipients.
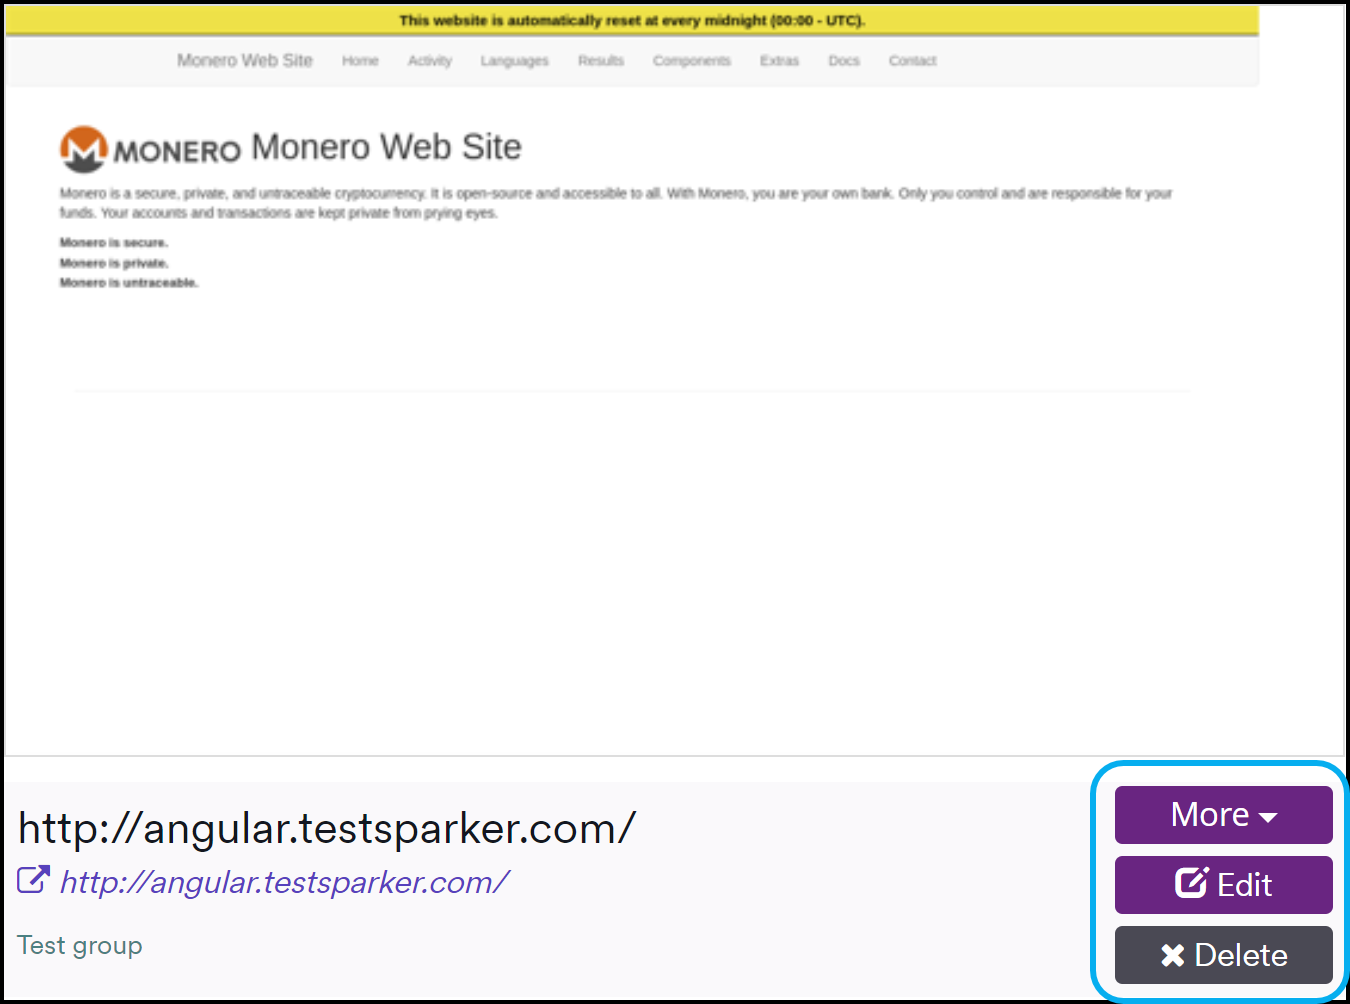
Target Preview
The target preview shows an image of the target, the name of the target, the target URL, and the target group.
In the More drop-down, you'll find the following options:
- Issues: Redirects to the Issues > All Issues page
- Scans: Redirects to the Scans > Recent Scans page
- Scheduled Scans: Redirects to the Scheduling > Scheduled Scans page
The Edit button takes you to the Edit target page, where you can edit the target details. Selecting Delete will remove the target. Once you delete a target, you cannot restore it or its data.
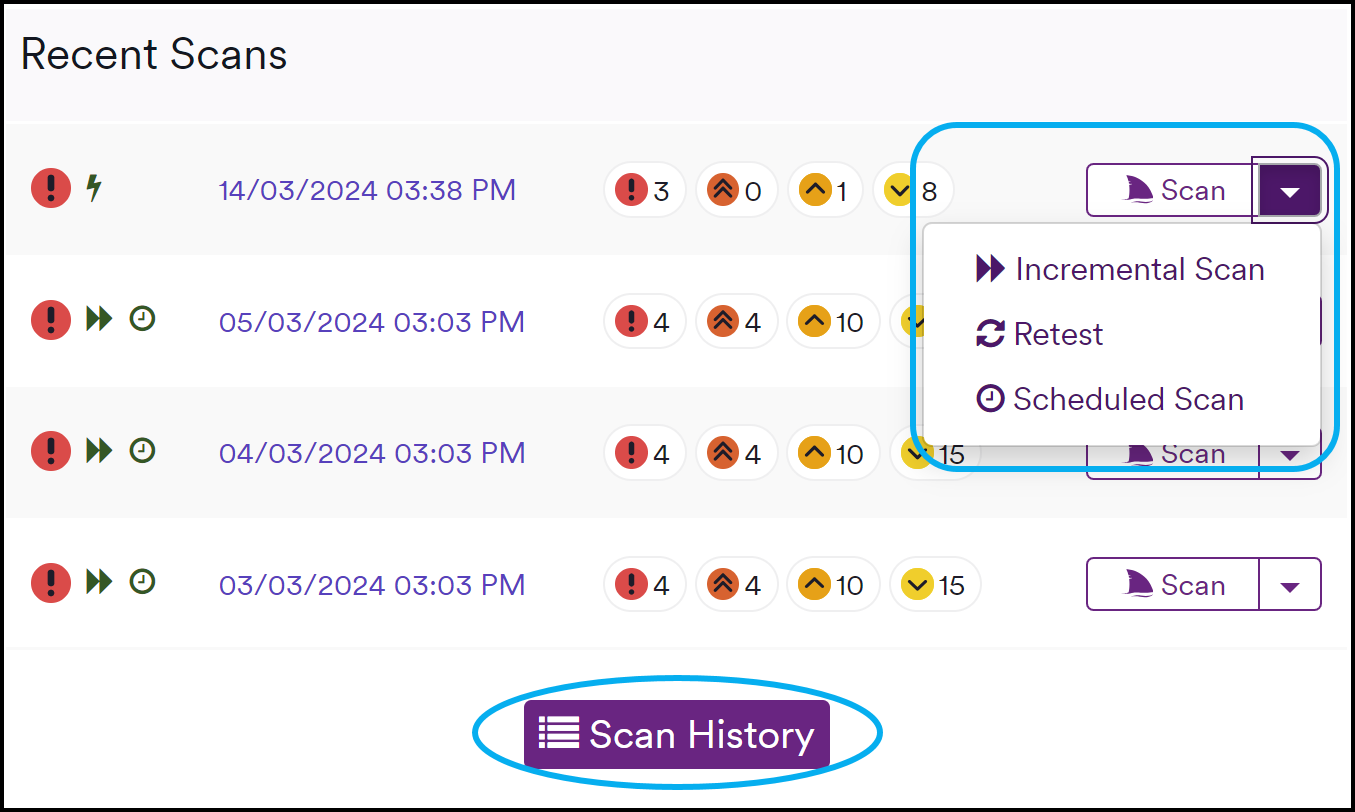
Recent Scans
This widget displays a list of all recent scans that are either In Progress or Completed. For each listed scan there is a count displayed for the vulnerability severity levels. The following actions are possible from the recent scans widget:
- Click on a scan in the list to go directly to its Scan Summary report.
- Click Scan to run a new scan of the target with the same set of configurations as the recent scan.
- Create an incremental scan with the parameters of the recent scan. Click the down arrow and select Incremental Scan.
- Perform a retest of the vulnerabilities detected in a recent scan. Click the down arrow and select Retest.
- Create a scheduled scan with the parameters of the recent scan. Click the down arrow and select Scheduled Scan.
The Scan History button at the bottom of the widget takes you to the Scans > Recent Scans page.
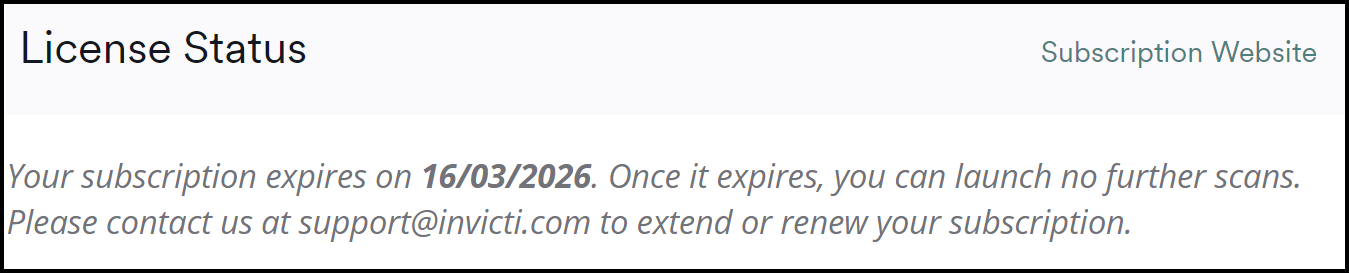
License Status
This widget informs you about your Acunetix 360 subscription expiry date. If you have more than one subscription, these will appear here, too.
Other dashboards
For information about other dashboards available in Acunetix 360, refer to the following documentation: