So, it’s that time of year again. The Verizon Data Breach Investigations Report is out and its time for us to take a good look and analyze their results. The cover, which is dark featuring an illuminati-style symbol and the pull out statistic of ‘89% of breaches had a financial or espionage motive’ promise some juicy details this year. However, critics have already been vocal about the suspect methodology of the report and whether its data can be considered accurate. Verizon is an oft-quoted report in mainstream media when covering cybersecurity so inaccurate or biased data could potentially be quite damaging. Let’s see what all the fuss is about….
Victims
In this section, the affected organisations of the 2015 dataset are broken down by industry, preempted by a disclaimer that public organisations might be over-represented due to government reporting requirements. No surprise then that they’re leagues ahead of other sectors, with a reported 47,237 incidents, followed by Entertainment, Finance and Information at between 1000 and 2,700 apiece. Professional (whatever that might be), Education, Retail and Healthcare all trail much further behind with no more than 250 each. Unfortunately, this is all the analysis we have of victims.
Trends
The second section is trends, which is always a crucial element in such a report as it gives the pull out quotes, the ‘what’s new’ of data breach statistics. This year, this section is oddly-written in a manner strewn with war and weaponry references. Ok, so this might not be a writing test but let me give you just a couple of quotes ‘the soldier is given a hand-me-down rifle with only a few rounds of ammunition’ and ‘Pistols at dawn, or knives at noon?’. Seems somewhat superfluous when all we want to know is what the latest attack trends are. We feel a little bit sorry for anyone whose English isn’t the strongest, they must be completely baffled here.
Anyway, the information worth having is that, as per the front cover, financial and espionage motivations are the top two reasons for attacks and data breaches. Next, attacks are broken down by method and this graph shows the evolution of attack method since 2005, with hacking, malware and social engineering all naturally increasing dramatically to become the top three methods.

They do admit that the results are somewhat skewed due to the ‘Dridex’ campaign.
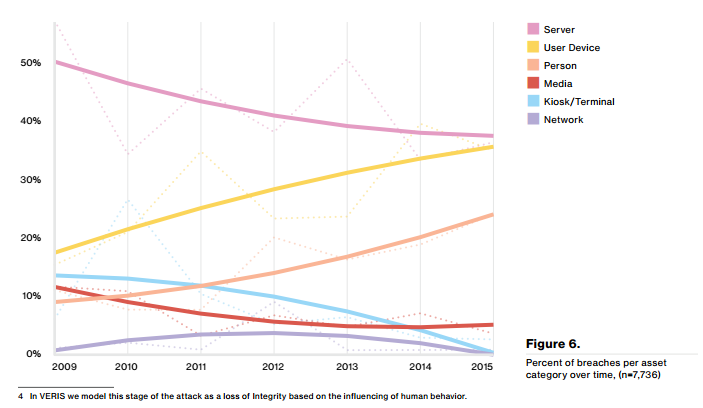
Another choice set of information and accompanying graph covers the attack surface leveraged in order to cause the breach, which unsurprisingly sees servers and user devices as the top points of entry.
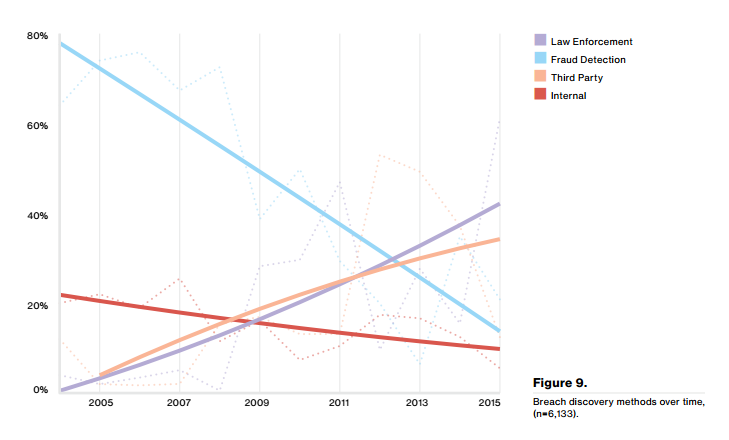
Finally, for this section, we see who discovered the breach and how this has evolved in the past few years, bringing third parties and law enforcement agencies to be far more common sources for breach discovery than they were previously. Fraud detection on the other hand, has massively declined.
Vulnerabilities
Now, a section we’re particularly interested in and were disappointed to find was also written in some rather bizarre English. But once interpreted and with the aid of the accompanying graphs, we can see why this set of data in particular has been subject to heavy criticism from other authors and security specialists. Verizon have admitted at the outset of this section that they did not have the data here themselves and have relied on third parties, stating ‘this lack of detail makes us an embarrassment of sad pandas’. Yes, that’s a direct quote. The data they have used apparently comes mostly from exploitation data owned by a company called Kenna Security (formerly Risk I/O), compared with vulnerability scan results from other third parties.
Now, to start with, the fact that Verizon have restricted their analysis only to vulnerabilities with CVE numbers is not exactly encouraging. There are many nuanced vulnerabilities and far from all of these have CVE numbers. This makes any analysis of ‘vulnerability’ data here heavily skewed. However, we’ll analyse it as we find it and leave you to draw your own conclusions.
The first finding they present us with breaks down the vulnerability exploitation time by the technology in which the vulnerability has been found. Unsurprisingly, Adobe vulnerabilities score very highly here for being the quickest vulnerabilities to be exploited, while the Mozilla products come in last.

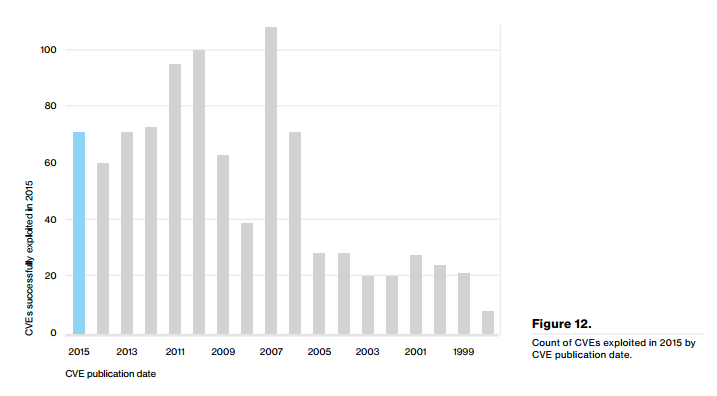
As last year, we have also been given a graph showing us the exploitation of vulnerabilities in 2015, broken down by the publication data of the CVE. As last year, this indicates that a number of vulnerabilities from as long ago as 2011 and even 2007 are still being heavily exploited. This comes with the claim that 85% of exploit traffic results from the top 10 vulnerabilities. Of these vulnerabilities, #3 is a local vulnerability based on a symlink overwrite flaw (CVE-2012-1054) in Puppet (an open-source configuration management tool) from 2012. Given the install base of Puppet versus that of Java, Adobe Reader, and Adobe Flash, this result doesn’t quite pass the ‘sniff-test’. Furthermore, the list doesn’t even remotely match the US-CERT’s “Top 30 Targeted High Risk Vulnerabilities” that includes vulnerabilities back to 2006.
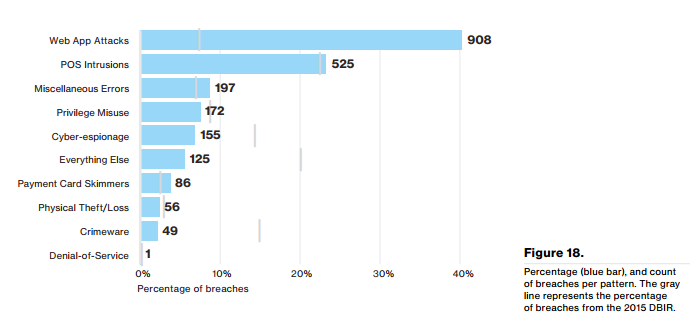
They close the section by recommending several actions, namely patching, having a plan B in case a patch or fix can’t be applied and finally regular vulnerability scanning, which we wholeheartedly agree with. Before moving on to our next area of interest, the web app attacks we’ll show you one of the more interesting graphs which breaks down the breaches by cause, noting that around 40% of successful breaches, as opposed to ‘incidents’ were caused by web app attacks.
Web app attacks
The web application attack section covers breaches caused by web app attacks and breaks them down in various ways, the most interesting of which being this chart, which shows us that stolen credentials and use of backdoors are the top two methods of hacking. The report does give some insight by saying that they also think this data heavily skewed by the Dridex campaign and its methods, which would be reflected by the statistic that 95% of the attacks had a financial motivation.

That’s sadly all we can really say on this section this year, it’s a little lacking in analysis and only goes so far as to point out that the backdoor attacks largely consist of remote file inclusion (RFI) vulnerabilities.
So there you have the highlights of this years ‘DBIR’, better known as the Verizon Data Breach Investigations Report and we’re glad they said it themselves in the wrap up section when they said it was ‘strange, long trip’ to get through the report. We completely agree, this year’s report has been very strange indeed to read, we suggest you check it out if only to marvel at the bizarre overuse of references to film, history, popular music and just about anything else the authors felt was relevant (it isn’t).
Get the latest content on web security
in your inbox each week.
THE AUTHOR